Diamond Cut Study
OctoNus Diamond
Cut Initiative
Publications
Rough and Polish diamond movies
Master Stone Set
Study of Interdependence:
Fancy-color Diamond Appearance, Cut, and Lighting Conditions
Fancy-Color Diamonds:
Better Color Appearance by Optimizing Cut

1 Content
2 Color optimization method
3 Diamond absorption spectra
4 Two representations of colors
5 A good fancy colored diamond should be bright and saturated
6 Color potential of a colored diamond plate
7 DiamCalc ray tracing options and photorealistic images
8 One spectrum - different cuts and different lightings
9 Process flow
10 Exploring rough diamond potential
11 Rough allocation example
12 Different allocation plans
13 Automatic color optimization
14 Optimization by color
15 Optimization by contrast
16 Optimization results
17 Computer-aided color optimization
18 Expert considerations
19 The final stage: expert decision
20 Verification of the technology: CZ material
21 Real photos of CZ stones and photorealistic images based on Helium scanned 3d models
22 Verification on fancy shapes CZ
23 Summary
24 More information about diamond cut study technologies
25 Terms of colorimetry science (Hunt, 2004)
26 Acknowledges
27 References
Computer modeling of gemstones for improvement of their color appearance
Visible adsorption spectra and DiamCalc-files of colored gem materials
3DBook
DiamCalc Internal Cuts gallery
External Cuts gallery (Dll)
Diamond cuts gallery
 
Two representations of colors
The range of all colors of one hue can be represented by different ways.
Two diagrams: Saturation vs. Brightness (top) and Chroma vs. Brighness (bottom) represent the same colors of yellow hue (Munsell 7.5Y). Circles show positions of Munsell color chips and dashed lines outline modern fancy grades of yellow diamonds.

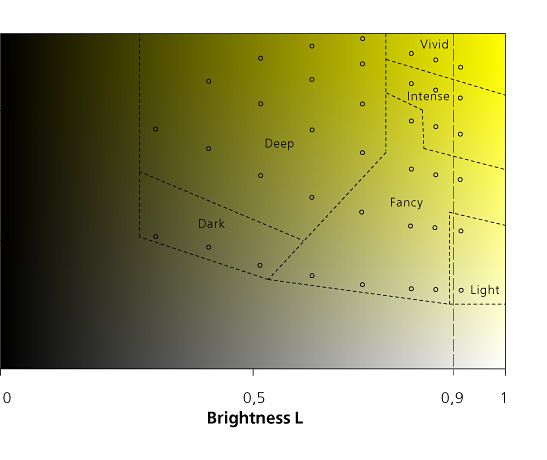
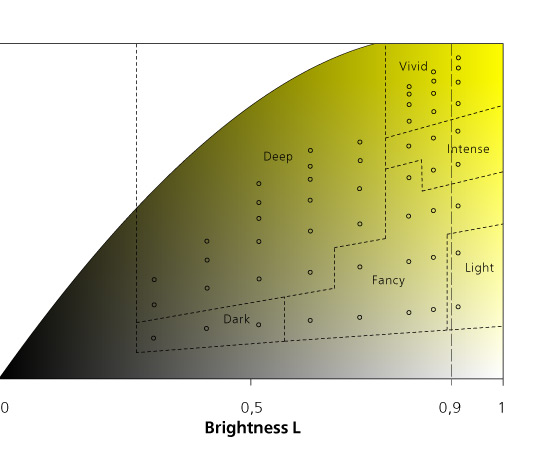
If a hue is fixed, for example, yellow, all colors of this hue described in terms of Saturation and Brightness of through Chroma and Brightness. Two diagrams here have the same horizontal coordinate: brightness but different vertical one on the left - saturation , on the right - chroma. The described technology supports both of these types of coordinates. There is an open question: which representation is the better to describe human abilities to differentiate color and describe this difference. On these pictures the positions of Munsell yellow chips used for color grading on the both diagrams are indicated as blank circles. First we recognize the position of Munsell chips on this diagram (different color system cross reference tables were used). After this we have used color grades for each Munsell chip according to the GIA paper published in Gems&Gemology in 1994.

Previous page Head of article Next page